Webtrends - All Saints Visualisation
A real-time data driven visualisation for HD displays.
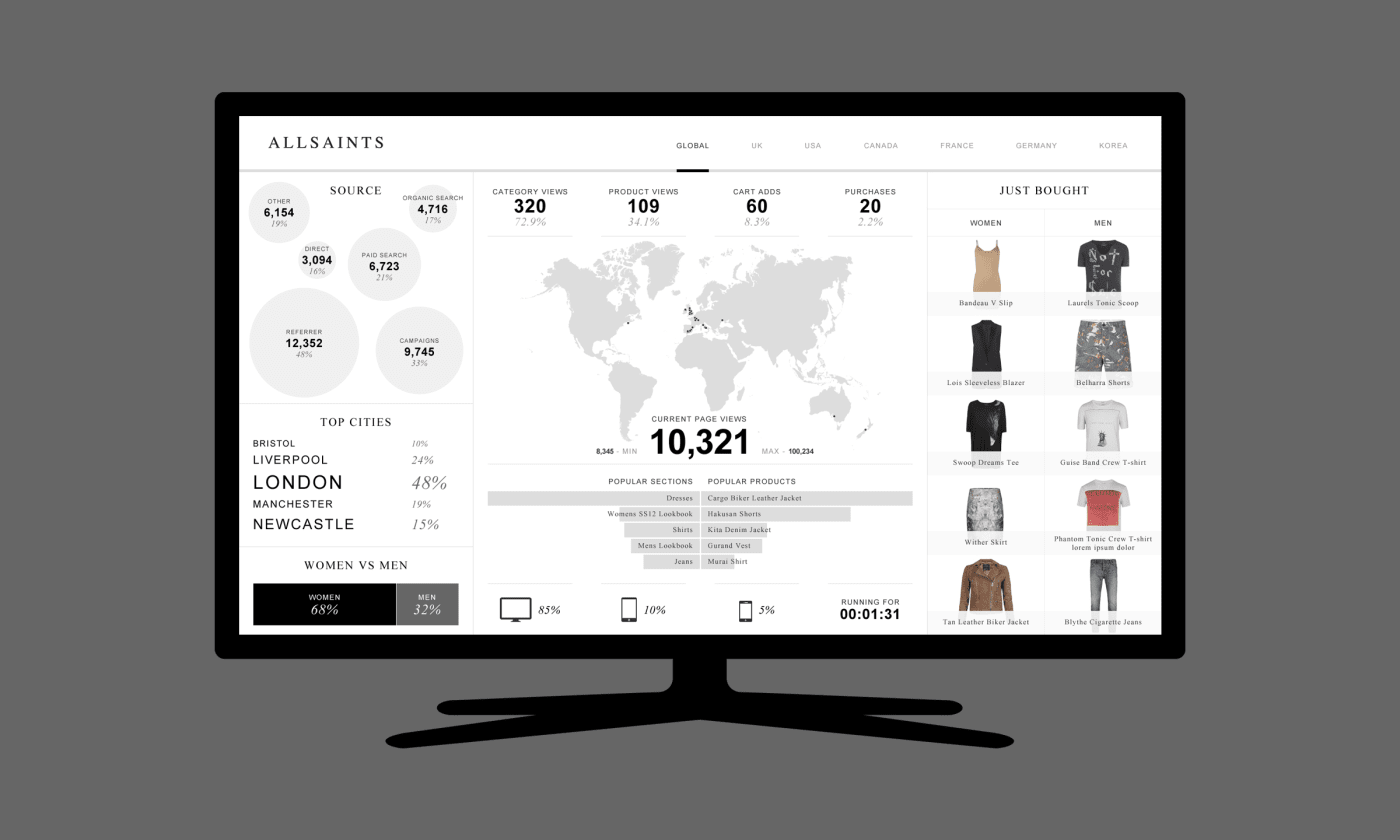
Collaborating with the analytics team at Webtrends, we designed and developed a real-time visualisation which displayed various bits of live data to be displayed in meetings and waiting rooms at their head offices. Data included things like products just bought, top cities of purchase, and which devices were being used to access the All Saints site.
Our design process needed to be tweaked a little due to the unpredictability of using live data, so we created a general look and feel in Photoshop while testing structure and movement in a working demo. This rapid back and forth and constant testing between design and development meant that we could avoid any unforeseen breaks in the final build.